TABLE OF CONTENTS
Note: The Leadership Dashboard is available upon request only. Please contact your Account Manager or support@century.tech to request access.

From the Overview page, click into a department or subject to view further information on your organisation’s usage. Here you are able to see usage metrics and alerts letting you know about activity within subjects, such as:
Overall data on the subject, such as total students, time studied and questions answered
Monitor department usage by subject
A deviation graph of time spent and average score over the last three months
This can be further filtered by student gender and pupil premium status
Use the drop-down menus at the top of the page to filter for a specific academic year or date range.

Class Data
To view further data on individual classes, go to the All Classes tab. This page displays each class’ subject usage, including key metrics such as active students, average scores and total study time.
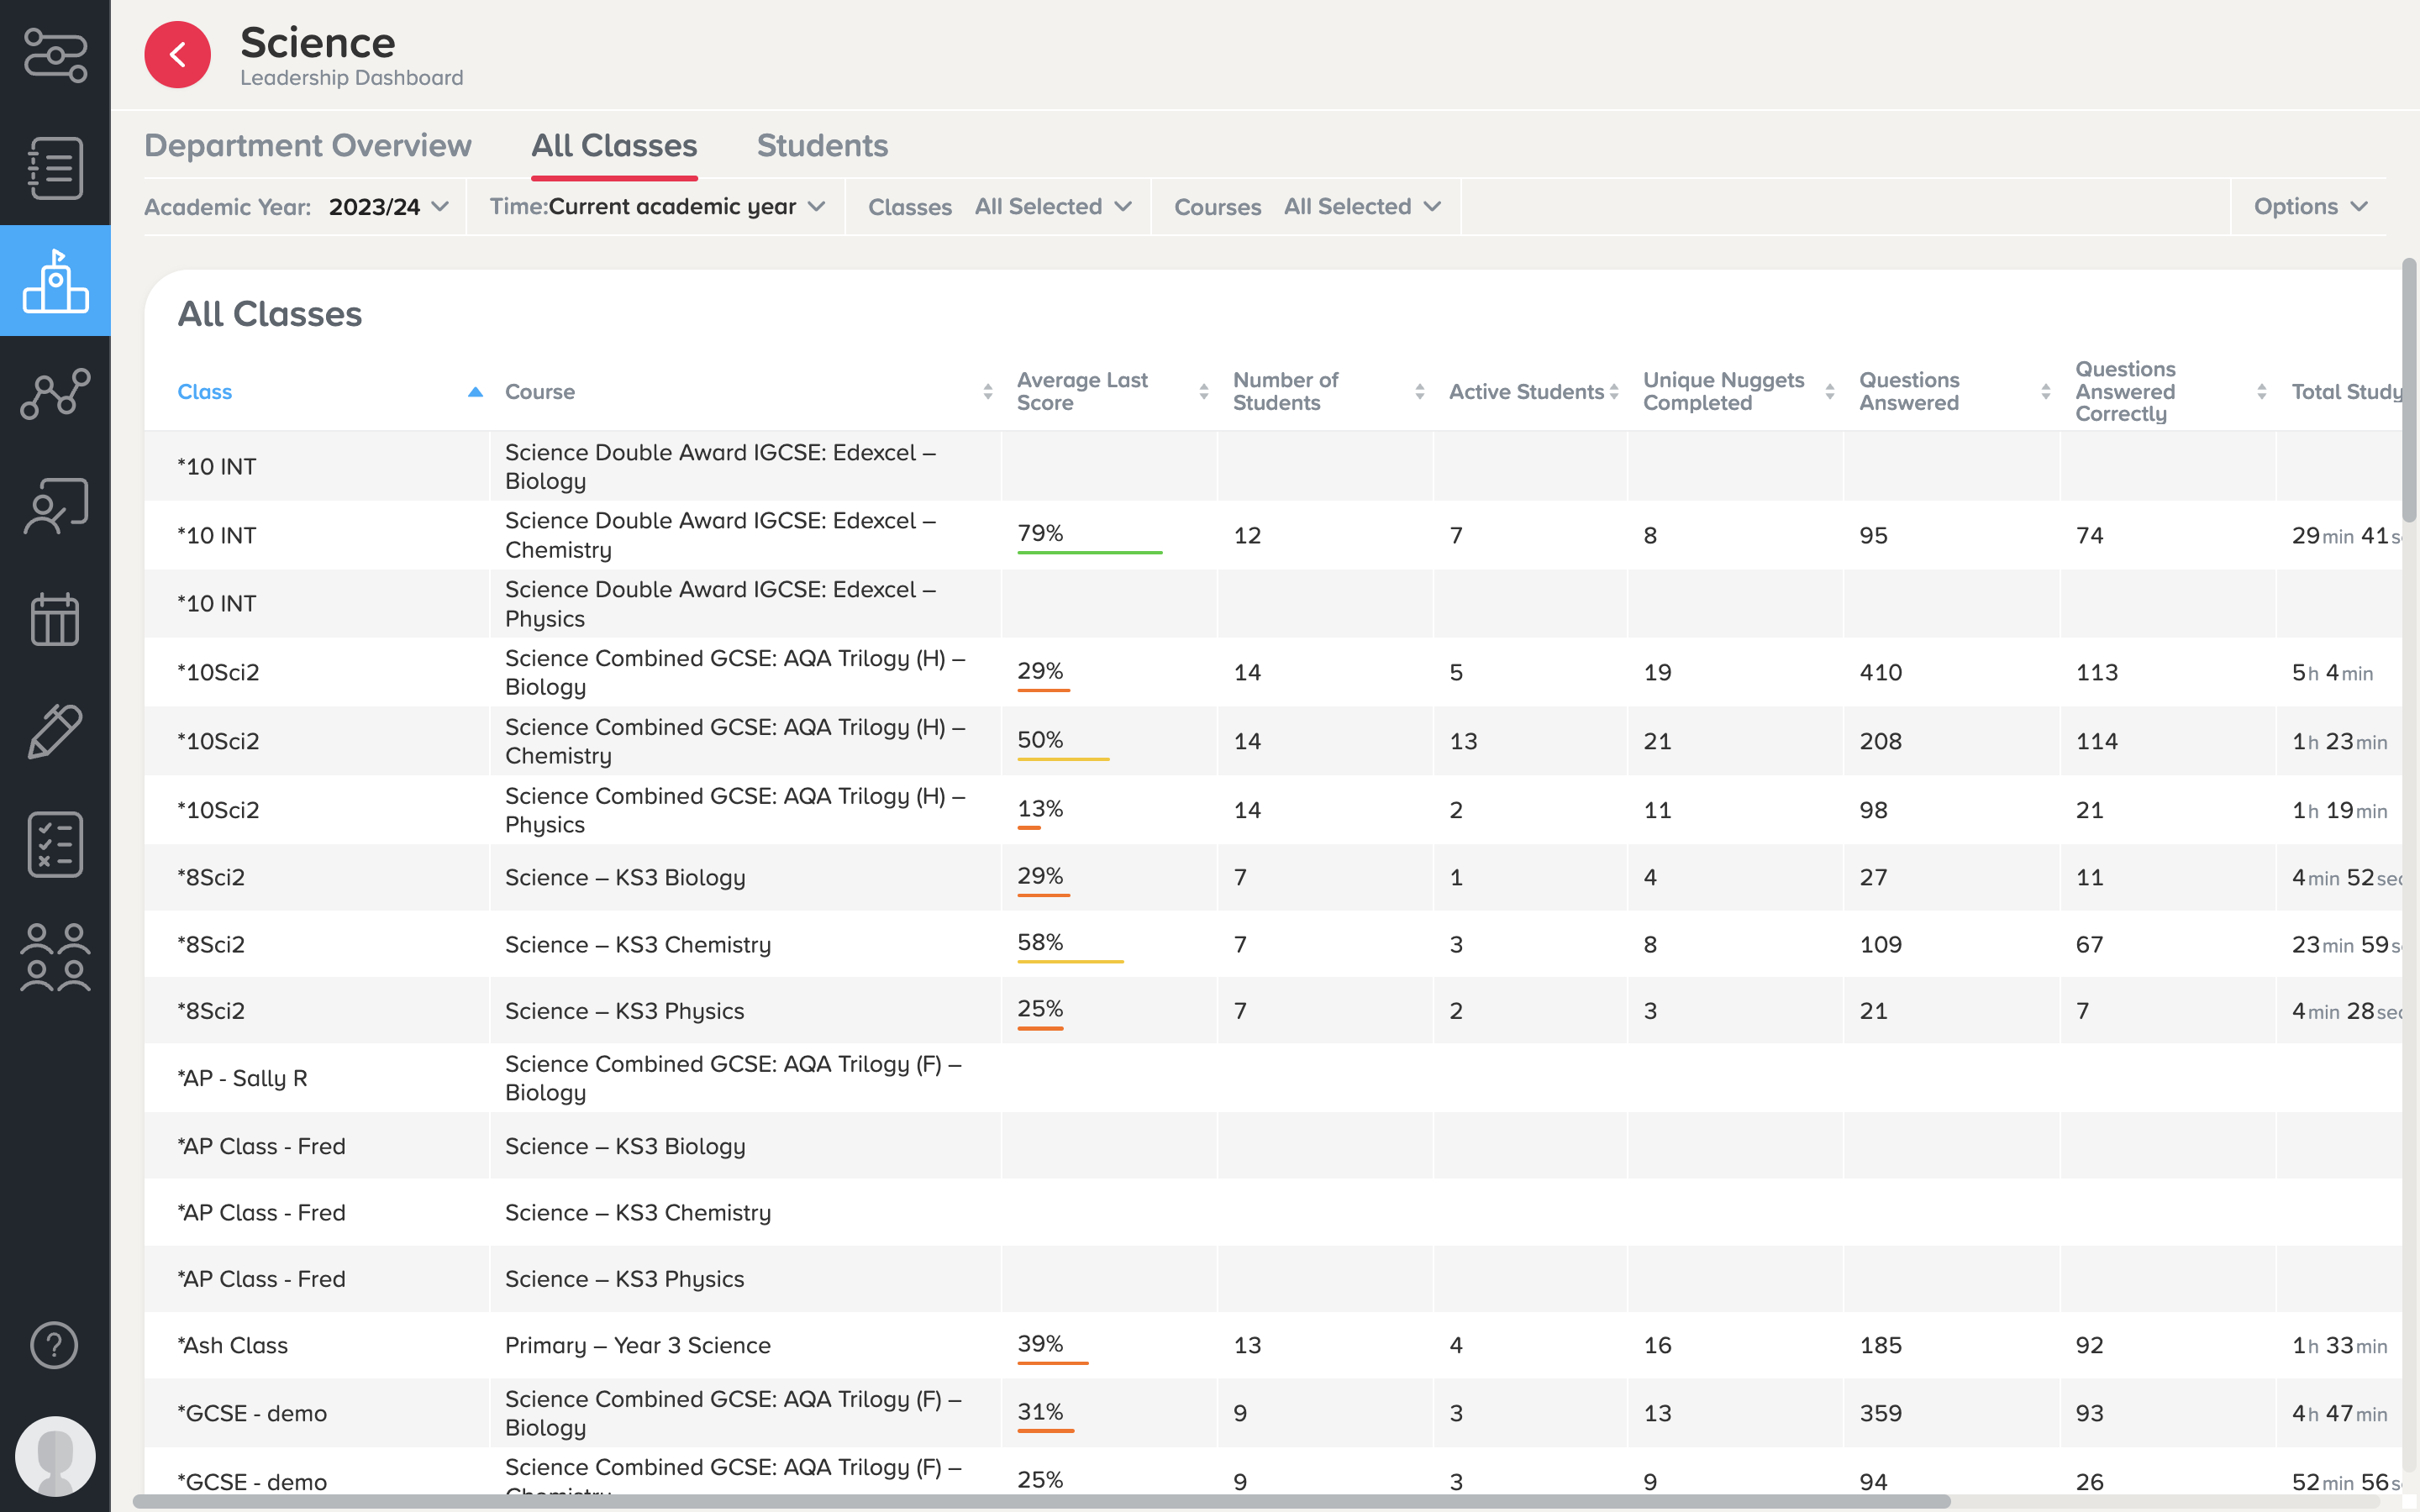
The drop-down filters can be used to drill down for specific usage by:
Academic year
Date range
Class
Course
Each heading can be sorted to show you the highest- and lowest-using classes.
To download the data on this page as an Excel document, select 'Options', then click 'Download as Excel'.

Student Data
You can also view individual students activity in the Students tab.

You can time stamp the data, change the academic year, or filter by gender and pupil premium.
All of the headings can be then sorted so you can see the students' performance based on metrics such as:
Nuggets Completed
Questions Answered
Average Score
Clicking into a student name will take you to their individual Student Dashboard, where you can view further information on their learning activity and progress.
It is also possible to download the data on this page as an Excel document by selecting 'Options', then 'Download as Excel'.
Was this article helpful?
That’s Great!
Thank you for your feedback
Sorry! We couldn't be helpful
Thank you for your feedback
Feedback sent
We appreciate your effort and will try to fix the article